Stress Maps and Distortion
1. Stress Maps
2. Distortion
Stress Maps
|
|
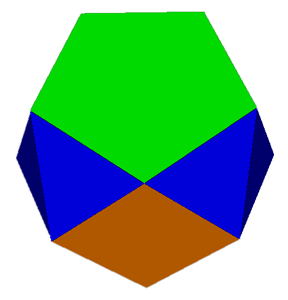
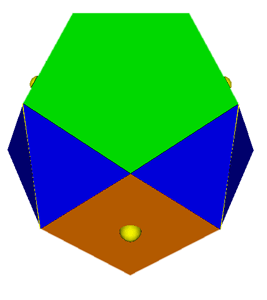
Stress Maps are a mechanism for displaying the distortion in a near-miss polyhedron. Take the two views above of a 5-5-4 acrohedron. The polyhedron is actually a near-miss but this is not particularly evident in a normal VRML file (left). With the stress map option used (right), distorted edges and faces are highlighted. Using the stress map option has no effect on a regularly faced polyhedron.
compressed edge |
extended edge |
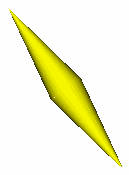
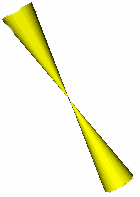
Distorted edges are shown in one of two ways. A compressed edge is shown as two cylinders base-to-base (left), an extended edge is shown as two cylinders apex-to-apex. The width of the bases is in both cases proportional to the extent of the distortion.
It is also possible for a face to be distorted beyond the distortion contained in the edges, for example a rhombus can be formed where all the edges are unity. In this case a sphere is shown in the centre of the polygon (see the images above). The radius of the sphere is proportional to the extent of the sum of the distortion of the major diagonals of the polygon.
Where the distortion is slight, the sizes of the cones and spheres may be exaggerated.
Stress Maps are generated by HEDRON (from v.1.8.0)
Where a polyhedron is a near miss, HEDRON will generate some statistics for these models. These are presented below each image as a triplet of numbers (E=?, P=?, A=?). For an undistorted model, this triplet will read (E=0,P=0,A=0).
'E' is the sum of the distortions of all of the edge lengths (assuming an edge length of 1)
'P' is the polygonal distortion, it is expressed as the sum of the distortion of all of the diagonals across each polygon. For polygons other than triangles, forms exist with all edge lengths 1 which are not regular (eg a rhombus).
'A' is the aggregate angular error. The absolute difference is determined between the angle of a regular polygon and the angle in the modelled polygon. These are summed for each angle in each polygon.
There are two ways in which these numbers can be read. 'E' and 'P' are both measures of side distortion ('E' is edges; 'P' is diagonals), there is an element of trade off between the two. An approximation to the extent of the distortion is given by 'E'+'P'.
'A' is a standalone measure of distortion, and is an attempt to quantify the 'nearness' of a near-miss in a single value.
Parameters can be set in HEDRON as to how the 'E'/'P' trade-off is to occur. My own personal preference is to limit the distortion to the smallest possible faces, this tends to reduce 'P' at the cost of 'E'. 'A' is a derived value and cannot be directly controlled, there is no processing in HEDRON to specifically minimise 'A'.
These figures are written into the VRML files and can be seen by accessing the VRML file with a text viewer. Information is also given about the most distorted edge and the breakdown of 'E' and 'P' across each edge and polygon.